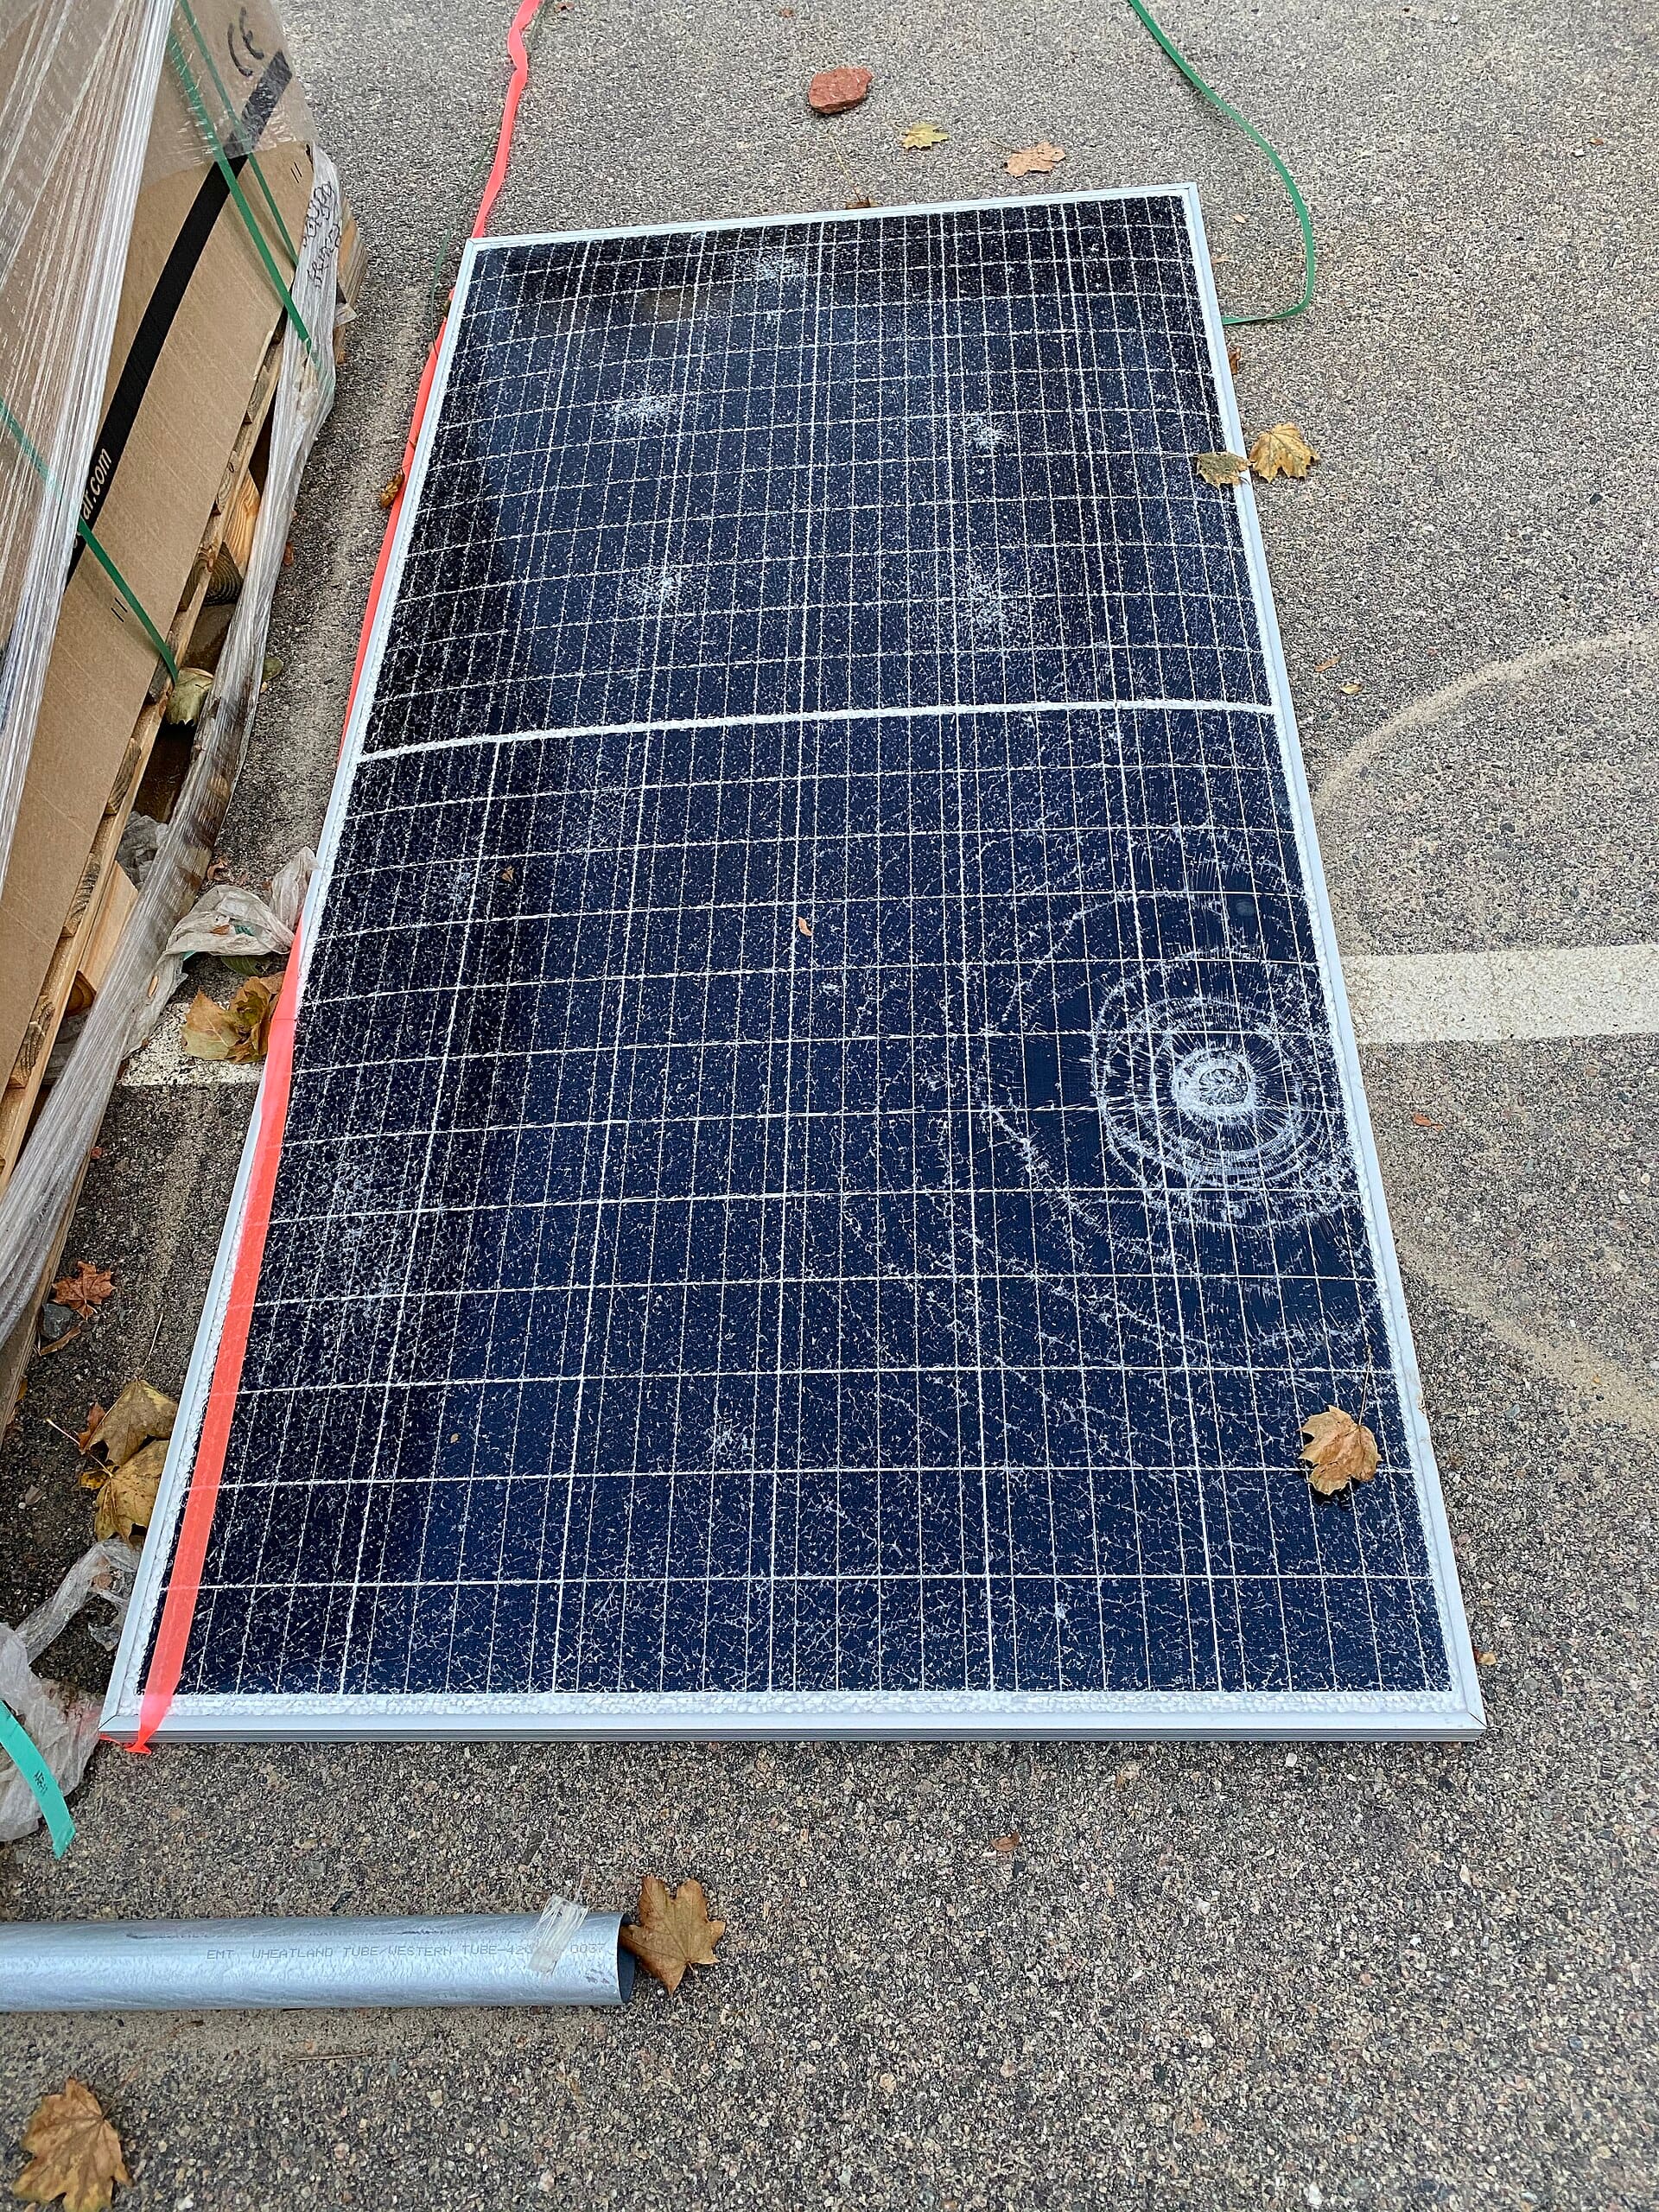
Somebody installs a system, measures the output in the first dry season and gets a figure that shocks them: a fifth below what the panels were sold to produce. The panels are four months old and nothing is broken. What has happened is solar panel degradation, and understanding it is the difference between a customer who is disappointed every August and one who knows what to expect.
Degradation is not one thing. It is an initial drop, a slow annual fade, a loss caused by moisture or voltage, and a loss caused by dust that is reversible and is not degradation at all. Mixing those up leads to bad decisions about warranties, replacements and system size, so this is the explanation.
Solar panel degradation, year by year
The industry describes degradation as an annual percentage of output lost, expressed against either the nameplate rating or the module’s own measured starting point. A warranty written as 87 per cent of nameplate at year twenty is a promise about the label. One written as 87 per cent of measured commissioning output is a promise about your array, and the second is stricter.
Two things follow. A panel already a little below its nameplate from day one has spent part of its degradation budget, so a good installer records the commissioning output precisely. And buying for year twenty means designing for the loss: if evening lighting has to be met from the bank, size the array for what it will make in year fifteen, not what it makes at handover.
The first-year drop and why it happens
Modules do not fade evenly from the day they are switched on. A noticeable share of the loss happens early, through light-induced degradation. The cells leave the factory with a surface that must stabilise under its first exposure to light, and the initial stabilisation step manufacturers use reduces this, but not to zero.
Measured initial losses in a long-running United States Department of Energy programme have been around half a per cent for one module family after its first twenty-two kilowatt-hours per square metre of light exposure, and around four tenths for another after the first ten. Field data from the same programme put most of the year-one drop at roughly one per cent on the older modules. Over a whole array that is small, but it is why a first-season reading should never be the baseline.
Less well known is the effect called light and elevated temperature-induced degradation. Some module families show a seasonal response: measured output falls after a spell of hot weather and recovers when things cool. If you measure at the wrong time of year, or only once, you can mistake a reversible seasonal swing for permanent damage. That is another argument for monitoring over years rather than one good reading in March.
What the field data actually shows
Brochures quote a single number. Field programmes do not, because the honest answer depends on the technology and on how the module was made. The most useful public dataset is the Department of Energy PV Lifetime project, which has measured the same branded modules indoors and outdoors for years.
| Module family in the field data | Reported annual change | Note |
|---|---|---|
| Multi PERC | About minus 0.3 per cent a year | Loss concentrated in the first year |
| Mono PERC | About minus 0.4 per cent a year | Loss concentrated in the first year |
| Longer-running poly and mono families | Between minus 0.35 and minus 0.55 per cent a year | Deployed from 2016 |
| Several newer families | Better than minus 0.25 per cent a year | Including modules that out-aged their indoor controls |
| One heterojunction bifacial family | Around minus 2 per cent a year | Loss on the front side, almost 8 per cent in total to date |
Two lessons. Half a per cent a year is a reasonable planning figure for a good modern module: warranty marketing of one per cent is not fantasy, but it is not typical. And the exception is real. One family in that dataset was losing far faster than the rest, with nothing on the datasheet predicting it, which is why a warranty naming a rate and a remedy beats a reputation.
At system level it is slightly worse, because a system is more than its modules. Aggregate fleet data shows a median system change of roughly minus 0.5 to minus 0.75 per cent a year, and about minus 0.5 per cent once recoverable soiling is excluded. A system is its weakest chain, not its best part.
How modules actually break down
Potential-induced degradation is the one to understand because it can be severe and it is preventable. It occurs when the cells, the frame and the mounting structure sit at different electrical potentials, usually because a module is bonded to earth or a frame is grounded while the cells float. A charge builds in the surface layer, and performance falls away. The field reference puts the worst case at up to thirty per cent power loss, which is catastrophic rather than gradual. It shows up in damp, humid conditions and it is a wiring and mounting problem, not a module defect. If your installer has grounded the frames of a floating array and not fitted the isolation the design needs, this is where it begins.
Hot spots come from shade, dirt, a cracked cell or a manufacturing flaw that sends a cell into reverse bias. The cell dissipates power as heat instead of producing it, and heat accelerates the failure. Research in the field describes hot spots as the most significant degradation mode in silicon modules of the last decade, and the endurance test for it is written into the module safety standard. This is the argument for a panel design that limits hot-spot temperature, such as one built from cut cells.
Micro-cracks and yellowing are the slow ones. A cell that cracks electrically still collects light but produces much less, and the module loses fill factor gradually. Discolouration of the encapsulant in a hot climate depends on the polymer used and on actual cell temperature, which is the argument for keeping panels cool and unshaded. None of this is fixed by choosing a technology word; it is fixed with orientation, clean glass, correct earthing and a supplier who will stand behind the module, which is worth checking on how to choose a solar installer in Nigeria.
What the warranty curve is really promising
A genuine performance warranty is a floor, not a forecast. It says that after a stated year, if measured output at standard conditions falls below a stated percentage of the reference figure, the maker will repair or replace, and how solar panel degradation is measured decides whether a claim succeeds. solar panel warranty terms are covered properly in their own article, but three questions are worth asking of any curve you are shown. What is the reference, nameplate or commissioning measurement? What conditions must the failure be measured under, and who does the measuring? And what is the remedy, replacement of the module, of the whole string, or a credit against the next purchase?
The measurement condition voids most claims. Warranties are written around standard test conditions, so a 440 watt panel cannot be properly assessed at eleven in the morning in April with a 55 degree cell. Genuine manufacturers accept a portable measurement or an on-site corrected reading. Anyone who says a claim cannot be verified because the technician lacked a laboratory flask is telling you the warranty has nothing behind it.
Soiling deserves separate mention because it is the commonest reason a customer believes a panel has degraded. Dust film and bird droppings can take a real share of output and, unlike degradation, it comes back when the glass is cleaned. solar panel cleaning in Nigeria covers the schedule. If output fell and recovered after rain, that was soiling, and no warranty will pay for it.
Frequently asked questions
How much do solar panels lose in the first year?
Usually around one per cent, occasionally two, and it is front-loaded. Part of it happens in the first hours of light exposure and part in the first year, and the field data shows the majority of the year-one drop occurring early rather than spread evenly. That is why the commissioning reading matters: it is the only honest baseline you will ever have.
Do solar panels stop producing after the warranty period?
No. A warranty ending at twenty-five or thirty years is a contractual limit, not a physical cliff. Modules below the floor are usually still producing, and plenty of well-built panels are still working after thirty years. Buy for the long life, but budget as though the year-one power is not coming back.
Is heat damage counted as degradation?
Heat changes the power you get on the day, which is a temperature effect and not degradation at all, and it returns to normal when the panel cools. Permanent heat damage shows up as discolouration or a lasting drop after years of operation. Keep the two apart in your head, because only one of them is a warranty matter.
Can I slow down degradation?
Only a little, and none of the popular answers are reliable. Keeping the array unshaded, cool and clean helps, and correct earthing on a floating array prevents the worst mechanism. Beyond that, be sceptical of any claim that a product lasts a fixed number of years, and read the annual rate in the warranty instead.
Key Takeaways
- Degradation is an annual percentage, and about half a per cent a year is a fair planning figure for a good modern module.
- Most of the loss happens early, so a first-season reading is a bad baseline and commissioning data is everything.
- Field data shows exceptions far worse than the typical rate, which is why the warranty remedy matters more than the brand.
- Potential-induced degradation can cost up to thirty per cent and comes from incorrect earthing, not from the panel.
- Soiling looks exactly like degradation and is not. Clean the glass before you claim anything.
- Design the system for the output you expect in year fifteen, not the output on the invoice.
Choosing panels that will age well starts with the module choices, and poly vs mono solar panels covers which of those choices actually change the long-term outcome.
Sources: PV Lifetime project annual report, measured degradation of mono and multi PERC modules, light-induced degradation losses and the heterojunction bifacial exception; solar panel performance and degradation, the degradation index and potential-induced degradation; Australian Renewables Agency study identifying hot spots as a leading degradation mode and the IEC 61215-2 endurance test; potential-induced degradation, its cause in stray currents and the effect on crystalline modules.


0 Comments