A vendor who quotes you a two-year solar payback period in Nigeria is not lying about the arithmetic, they are lying about the inputs. The honest figure for a well-designed home system with a usable battery bank is usually somewhere between five and nine years, and for a heavily battery-dependent commercial system it can be longer still. The difference is not dishonest intent, it is which costs get counted, which savings get banked, and whether the diesel that used to run the freezer is remembered. Here is the arithmetic done properly.
What goes into the cost side of the calculation
A solar payback period is only meaningful if both sides of the fraction are complete, and each side has a habit of being quietly incomplete. On the cost side, count everything you actually spent to get electricity: modules, inverter, battery bank, charge controller, mounting, cable, protection, earthing, the survey and design, the installation labour, permits, and the cost of any distribution board work. Include the money you spent fixing the problems after the first year, and subtract nothing except genuine discounts and the resale value of equipment you might sell.
Two things get quietly left out and both inflate the result. The first is labour and the balance of system, because a lot of quotes present hardware only. The second is the battery replacement you will eventually need, which for lithium you can model because the cycle life is published. Leaving out a known future cost is a choice, and it should be a conscious one rather than an oversight.
What you should not do is divide the capital cost by the savings and then call the result a return. It is not a return, because the system then depreciates afterwards. Over a 25 year life, annual savings divided by the original cost will always exceed the reciprocal of the payback period, and that difference is consumed by equipment replacement later on. Our article on what a solar installation cost should itemise covers the cost side in detail.
What savings you can actually bank
This is where most payback arithmetic goes wrong, usually in the buyer’s favour. Count only the electricity you genuinely displace, valued at the rate you genuinely pay.
If a family runs a generator for four hours a day during a twelve-day period in the year, that is 48 hours a year of displaced generation, and the payback period is calculated on those 48 hours, not on the other 8,760. Dividing an annual bill that includes a year-round lighting or water bill by a solar system’s whole output overstates the saving. If the grid supply is reliable for part of the year and you pay for that electricity, count the solar energy as displacing the grid tariff where it actually lands, and only count diesel where diesel actually ran.
The second error is ignoring what you were spending money on that you will now pay for in naira instead. A generator needs servicing, fuel delivery and storage, and it depreciates. An inverter needs no fuel and almost no servicing. If your calculation ignores the diesel servicing invoice, you have not saved what you think you have saved. It also ignores that a battery bank is a consumable asset, which is a genuine ongoing cost and belongs in the calculation as one.
The third is the electricity you simply cannot bank because your battery was flat. Output that never reaches a load is not a saving, and it quietly lengthens the payback period by months. A system sized for peak array output with a small bank will dump energy into a full battery at midday, and that energy is worth nothing unless the load exists at that hour. Sizing for the evening is what makes the difference, and it is covered in battery bank sizing.
Why battery-heavy systems pay back more slowly
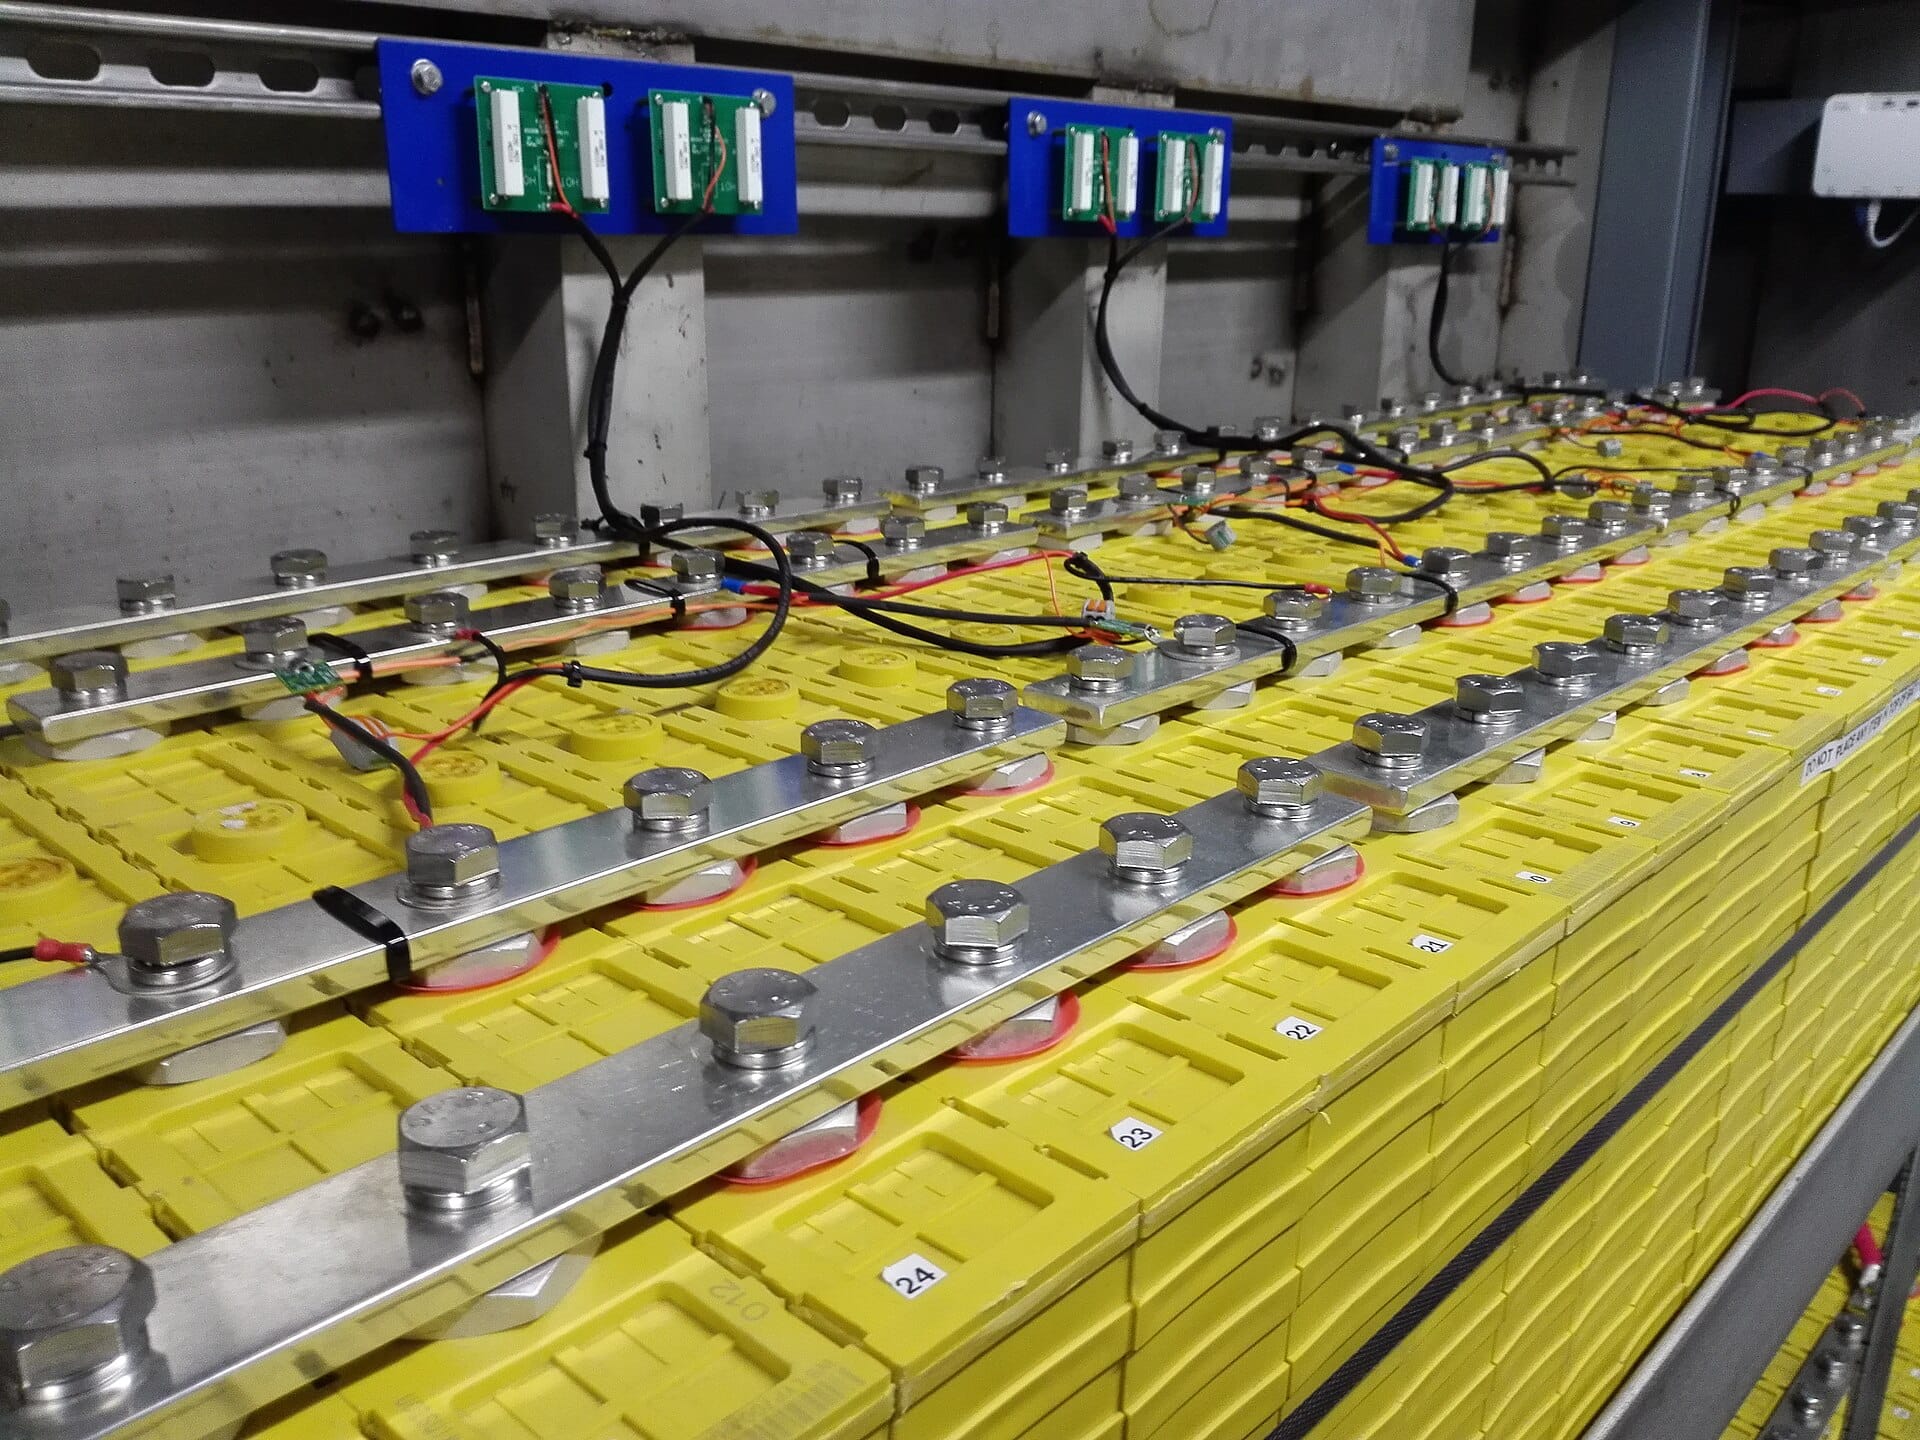
Because the battery is the most expensive part of the system and the shortest-lived, and neither fact improves with scale. Panels last decades. The battery carries most of the capital cost in a system with real autonomy, and it is the component you will most likely replace. Each additional hour of backup is bought entirely with storage, so a design that doubles autonomy also roughly doubles the capital outlay, while the savings only rise if your evening load actually needs those hours.
This produces a shape that surprises people. Adding panels to a system that already has plenty of battery is usually good value, because the extra energy displaces cheap grid or diesel energy at very low marginal cost. Adding battery hours to a system that already has plenty of panels is usually the expensive direction. A common mistake is to buy a large array and a small bank, then wonder why the surplus is thrown away.
There is a second reason battery-heavy systems look worse on paper: the savings are front-loaded in the comparison but the spend is not. If you were already paying a modest grid bill, the incremental solar saving per naira spent is low until the battery is also paid for, and the payback period stretches accordingly. The arithmetic is in our guide to the payback calculation if you want the formula laid out, but the underlying point is that autonomy is a lifestyle purchase and it should be costed as one.
Comparing solar against diesel honestly
Most Nigerian solar business cases begin by replacing a generator, so the comparison needs to be made on fuel cost per kilowatt-hour rather than on an electricity tariff. Generators are inefficient at part load, and a household running a fridge, a television and some lights is well below the load that suits the engine. Published consumption figures for modern diesels put specific consumption around a quarter of a litre per kilowatt-hour near full load, rising to roughly a third or more at half load, and much higher when the engine is lightly loaded or idling. The consumption by load level is the reference to work from rather than any rule of thumb.
| Situation | What to count as the saving | Effect on payback |
|---|---|---|
| Diesel generator runs several hours most days | Full fuel cost avoided, plus servicing and fuel delivery | Shortest payback of any group |
| Diesel runs a few days a year only | Only those hours of fuel | Payback measured in many years |
| Grid supply reliable, modest bill | Grid tariff displaced, mostly at daytime | Long payback unless the bill is large |
| Business with spoilage risk from outages | Count avoided loss, not just electricity | Looks fast, but only if you have real spoilage data |
| Household buying bottled or generator power at high unit cost | Full retail energy cost avoided | Short payback, because the baseline is high |
The honest conclusion is that solar payback is fastest where the alternative energy is expensive, and slowest where it is cheap. A household in a compound buying diesel at retail to light four bulbs will recover the cost quickly. A household in a city flat with a stable prepaid meter connection will not, and no amount of salesmanship changes that. A business that loses stock in an outage should count avoided loss only if it has actual figures for it, and should be careful: expected loss is not the same as a guaranteed saving, and treating it as one is how a payback model gets built on hope.
Working out your own solar payback period
Four inputs give you a payback period, and each one has a defensible source if you look for it: the installed cost from your own invoices, the energy you displace from your own load list, the value of that energy from your own bills, and the system degradation rate from the warranty curve rather than from optimism. Get the second one from your own load list rather than from the array size, and get the fourth from the warranty curve rather than assuming panels never fade. Panel output declines every year, and our article on solar panel degradation covers what the published curves actually promise.
Then run it twice. Once on today’s diesel price and once on a diesel price 20 per cent higher, and note how far the payback period moves in each. If it is still acceptable in the pessimistic case, the design is sound. If it only works at today’s price, you are not making an engineering decision, you are making a bet on fuel prices, and you should size the system to survive the bad case. Nigeria’s solar energy potential gives you the yield figures to make the energy side defensible.
Frequently asked questions
How long does solar take to pay back in Nigeria?
For a home system with a usable battery bank, usually between five and nine years when the diesel alternative is genuinely expensive, and considerably longer when the alternative is a cheap, reliable grid connection. For a small commercial system facing frequent outages and spoilage, it can be faster. The figure that matters is the one built from your own diesel spend and your own load, not a national average.
Does a longer warranty shorten the payback period?
It changes the risk, not the arithmetic. A longer warranty reduces the chance of a large unplanned replacement, which makes the projection more trustworthy, but it does not by itself make the money come back faster. What shortens payback is lower capital cost per unit of useful energy, and that comes from better sizing, not from better paper.
Is payback even the right way to think about it?
It is the right way to think about a purchase, and the wrong way to think about a business decision. For a home, cash flow matters, so payback is a fair test. For a shop losing stock every week, the question is whether the cost of continuing to lose stock exceeds the cost of the system, which is a comparison of running costs, not a division.
Key Takeaways
- Count every cost, including labour, balance of system and future battery replacement, or the period is fiction.
- Count only the energy you genuinely displace, at the rate you genuinely pay.
- Add the diesel servicing and fuel delivery you stop paying, because that is a real saving.
- Energy wasted into a full battery at midday is a saving you cannot bank.
- Battery-heavy designs pay back slowest, because hours of autonomy are bought entirely with storage.
- Run the calculation at today’s diesel price and at a higher one before you commit.
If you want the energy side of the model filled in properly, start with how many panels you actually need and how much storage to pair with them.
Sources: diesel generator fuel consumption by load level; diesel generator, efficiency and part-load operation; PVGIS, European Commission Joint Research Centre (modelled Nigerian solar yield).


0 Comments